The 2dF Galaxy Redshift Survey (2dFGRS) is a major spectroscopic survey taking full advantage of the unique capabilities of the 2dF facility built by the Anglo-Australian Observatory. The 2dFGRS is integrated with the 2dF QSO survey.
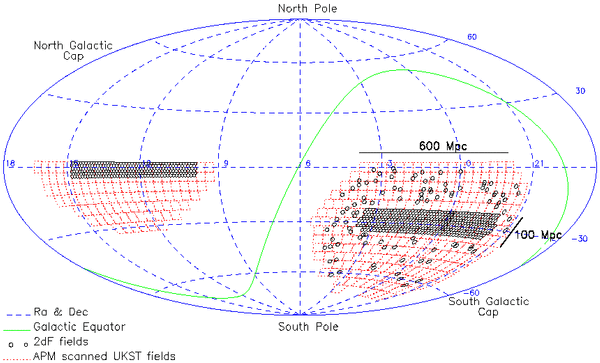
The 2dFGRS obtained spectra for 245591 objects, mainly galaxies, brighter than a nominal extinction-corrected magnitude limit of bJ=19.45. Reliable (quality>=3) redshifts were obtained for 221414 galaxies. The galaxies cover an area of approximately 1500 square degrees selected from the extended APM Galaxy Survey in three regions: an NGP strip, an SGP strip and random fields scattered around the SGP strip. The arrangement of survey fields is shown below.
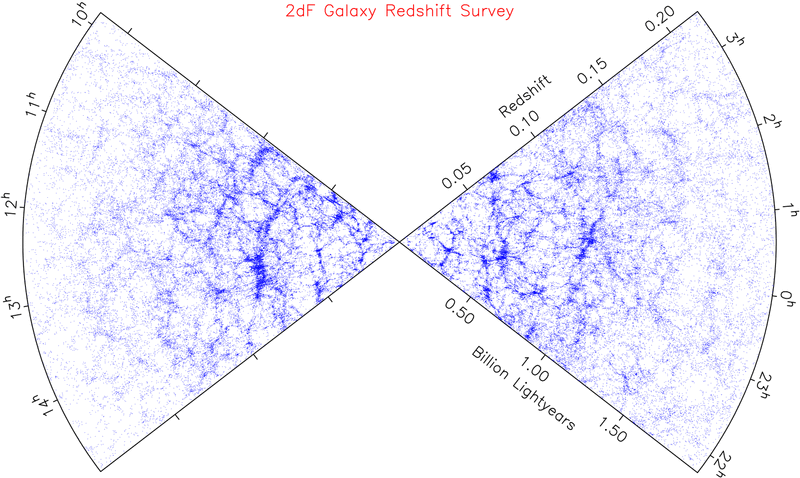
The 2dFGRS survey and its database are described in detail in Colless et al. (2001), with additional documentation and updates provided here. The figure below shows the map of the galaxy distribution produced from the completed survey (other versions of this figure in various image formats are accessible from the 2dFGRS gallery).
The survey has been used to address a variety of fundamental problems in galaxy formation and cosmology. The results emerging from the survey to date include:
- An accurate measurement of the power spectrum of galaxy clustering on scales up to 300h-1 Mpc, allowing precise determinations of the total mass density of the universe and the baryon fraction (Percival et al. 2001).
- Measurements of the distortion of the clustering pattern in redshift space, providing independent constraints on the total mass density and the spatial distribution of dark matter (Peacock et al. 2001 and Hawkins et al. 2003).
- A strong new upper limit on the total neutrino mass (Elgaroy et al. 2002).
- In combination with observations of the cosmic microwave background (CMB), precise measurements of the Hubble constant and the baryon density, evidence for a non-zero cosmological constant (dark energy), and constraints on the equation of state of the dark energy (Efstathiou et al. 2002 and Percival et al. 2002).
- The first direct measurements of the galaxy bias parameter, both from higher-order correlations in the galaxy distribution (Verde et al. 2002) and from comparison with the CMB power spectrum (Lahav et al. 2002).
- A characterization of the galaxy luminosity function in both the optical (Norberg et al. 2002) and near-infrared (Cole et al. 2001), with the former yielding the mean current star-formation rate and the latter the stellar mass function of galaxies.
- The distribution of galaxies as a joint function of total luminosity and central surface brightness (Cross et al. 2001).
- The luminosity functions for galaxies with different spectral types, both in the field (Folkes et al. 1999 and Madgwick et al. 2001) and in clusters (De Propris et al. 2003).
- The variation in clustering properties of galaxies as functions of luminosity (Norberg et al. 2002) and spectral type (Madgwick et al. 2003).
- Constraints on the cosmic star-formation history from the mean galaxy spectrum in the local universe (Baldry et al. 2002) and the environmental dependence of star-formation rates of galaxies around clusters (Lewis et al. 2002).
- The properties and luminosity functions of radio sources of various types (Sadler et al. 2002 and Magliocchetti et al. 2002).
- The properties of previously-identified clusters of galaxies in the survey, and dynamical estimates of the cluster masses (De Propris et al. 2001).
Further results emerging from the 2dFGRS are described in other publications of the 2dFGRS team.
The final release dataset comprises the following elements:
- The input photometric catalogues (source catalogues) for the full 2dFGRS survey, containing data for 382323 objects, together with related material.
- The spectroscopic catalogues for 245591 objects, containing the spectroscopic parameters such as redshifts and spectral types.
- The mSQL database, which allows searching and subsetting of the public release data, and provides access to the FITS files containing the spectra as well as all the other photometric and spectroscopic parameters.
- The survey mask software for determining whether a given position is in the survey region, and the survey magnitude limit and redshift completeness at that position; also selection software for extracting various types of subsamples and creating corresponding mock catalogues.
- Documentation, both on-line and through links to survey publications.
- Additional material such as images, movies and stills, media reports and links to related topics.

