Response Function
The 2dFGRS spectra are not flux-calibrated. The following describes measurements of the average 2dFGRS response function, which allows approximate relative flux calibrations.
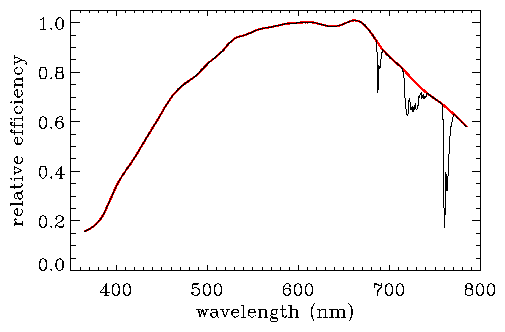
The 2dF response function (with the 2dFGRS setup) was measured by observing a set of stars with measured ugriz magnitudes from the SDSS. The 2dF spectra were divided by model spectra that matched the magnitudes to determine the relative efficiency as a function of wavelength. The average relative efficiency is plotted in Figure 1. The observations were taken in January 2001 and the results published in "The Anglo-Australian Observatory's 2dF Facility" (Lewis et al. 2002, MNRAS, 333, 279).
| Figure 1: 2dF relative efficiency curve from observations taken in January 2001 (Lewis et al. 2002). The red curve shows the efficiency without the strongest telluric and fibre absorption, while the black curve includes the average absorption from those bands. The data for these curves: eff-sc.dat and eff-all-sc.dat (notes: Angstroms, efficiency; extrapolation below 3650A and above 7850A; corrected to account for differential seeing between wavelengths). Absorption bands only: eff-telluric.dat. |

|
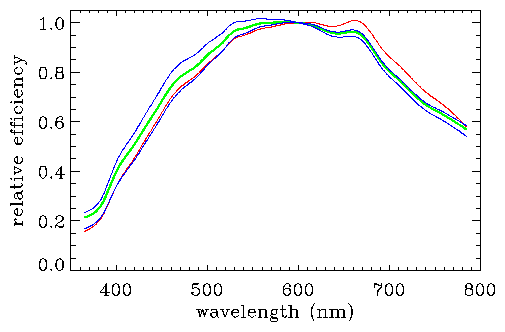
The above response curve represents the result of less than one hour of observations. The true average 2dFGRS response function could differ from this due to, for example, response variations over the survey time (1997-2002), unaccounted-for differences between galaxy and stellar observations and inaccuracies in the preliminary SDSS magnitudes. To account for this, we allowed for a spectrophotometric correction for the "constraints on cosmic star-formation history from the cosmic spectrum" (Baldry et al. 2002, ApJ, 569, 582). Some solutions for the 2dF response curve from the best-fit models are shown in Figure 2. Note that the best-fit models are principally constrained by the high pass components of the cosmic spectrum in comparison with the PEGASE population synthesis models. Evidence, that our spectrophotometric correction was in the right direction, came from a comparison of K-corrections and SEDs from previous studies with results for the different 2dFGRS spectral classes using various response corrections (Madgwick et al. 2002, MNRAS, 333, 133).
| Figure 2: Solutions for the average 2dFGRS response (Baldry et al. 2002). The red curve shows the efficiency from Figure 1. The green and blue curves show a range of efficiency curves after spectrophotometric corrections resulting in good fits to PEGASE model spectra. The data for the curves: eff-pop-syn-mid.dat, eff-pop-syn-min.dat and eff-pop-syn-max.dat (notes: efficiency normalised to 1.0 at 6000A; telluric and fibre absorption bands not included, see Figure 1). |

|
Conclusions: These response curves can be applied on average to give an approximate relative flux calibration for the 2dFGRS spectra. However the results for individual spectra will vary considerably due to sky subtraction and efficiency variations over each plate. A recommendation would be to use the 'mid.dat efficiency curve, with the 'min.dat and 'max.dat curves providing a systematic uncertainty if required. (N.B. don't forget to include an average telluric absorption correction, if not done on a plate by plate or nightly basis).
Summary of files:
- eff-sc.dat: measured 2dF response excluding strong absorption bands.
- eff-telluric.dat: average profiles of absorption bands.
- eff-all-sc.dat: response including absorption bands.
- eff-pop-syn-min.dat: solution for average 2dFGRS response, minimum deviation from the measured response.
- eff-pop-syn-mid.dat: solution for average 2dFGRS response, mid-range deviation.
- eff-pop-syn-max.dat: solution for average 2dFGRS response, maximum deviation.