Power Spectrum Introduction
 Present-day structure formed by the gravitational amplification of
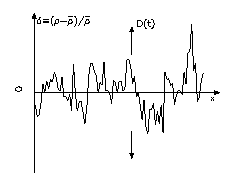
small density perturbations created in the early Universe. The plot on
the right shows a realisation of a 1D density field. As time increases,
the perturbations grow due to gravity, eventually becoming the structure
observed in the Universe today. The distribution of the perturbations is
dependent on the physical processes at work shortly after the big bang.
Galaxy redshift surveys such as the 2dF galaxy redshift survey (2dFGRS)
map the distribution of galaxies within the local Universe and therefore
map the galaxy seed perturbations. Encoded in this are the properties of
the early Universe.
The galaxy density field is usually described in terms of its Fourier modes. The power spectrum gives the squared amplitude of these modes, and provides a measure of the clustering of galaxies on a given scale. For a Gaussian random field this statistic is complete, in that it contains all of the information about the field.
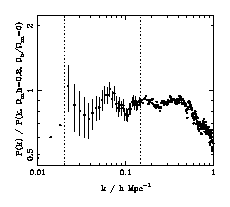
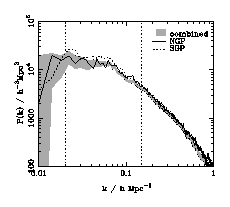
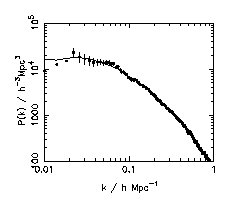
The 2dFGRS, completed in April 2002, is a major new galaxy redshift survey and has already provided a detailed map of the local Universe. The power spectrum of the preliminary galaxy catalogue, shown in the diagrams below has provided the first detection of the signature of baryons in large scale structure. Note that it is not the oscillatory features that give this detection, but the overall shape of the power spectrum.
 |
 |
 |
| The 2dFGRS power spectrum, calculated from the distribution of the 147000 galaxies observed prior to February 2001, ratioed to a zero-baryon CDM model in order to highlight features. | The 2dFGRS power spectrum from two distinct sections of the survey: the North Galactic plane (NGP) and the South Galactic plane (SGP), compared to that recovered from the whole survey. | The 2dFGRS power spectrum compared to the average recovered power spectrum from the Baugh et al. (2001) LCDM mock catalogues(details here). |